

Pump Vibration Analysis: A Practical Guide for Maintenance Engineers
Introduction
Vibration is a pump's own language. Long before a bearing seizes or a seal starts to weep, the machine is already telling maintenance engineers something is wrong — through frequency, amplitude and phase. Learning to read that signal is the difference between a planned five-minute bearing swap and an unplanned eight-hour outage.
This guide walks through the practical side of pump vibration analysis: why it matters, the most common causes of excessive vibration, how to interpret frequency spectra, what ISO 10816 and ISO 20816 actually require, and how to build the process into a predictive maintenance programme.
This guide applies broadly across power, pulp & paper, chemical, mining, fertilizer, sugar and water treatment installations — wherever rotating pump equipment is critical to uptime.
Why Pump Vibration Matters
Every centrifugal pump vibrates to some degree — the question is whether that vibration stays within a safe operating envelope. Left unchecked, elevated vibration accelerates bearing wear, fatigues shafts, loosens foundation bolts, damages mechanical seals and steadily erodes hydraulic efficiency.
Unlike a sudden trip or alarm, vibration-driven damage is progressive. That progression is exactly what makes it valuable: a rising vibration trend gives engineers weeks of warning that a reactive maintenance strategy would otherwise miss entirely.
Track vibration as a trend, not a single reading. A steady value at 3 mm/s is far less concerning than a value that has doubled over the last three months, even if both sit inside the "acceptable" zone.
Common Pump Vibration Causes
Most pump vibration problems trace back to a small set of recurring mechanical and hydraulic issues. The table below summarises the most frequent causes, how they typically present, and the recommended first response.
| Cause | Symptoms | Severity | Recommended Action |
|---|---|---|---|
| Impeller / rotor imbalance | Vibration at 1× running speed, radial direction | Medium | Dynamic balance the rotor; check for debris or wear on impeller vanes |
| Shaft misalignment | High axial vibration, coupling heat, seal leakage | High | Realign pump-to-motor using laser alignment tools |
| Bearing wear / defects | High-frequency noise, rising vibration at bearing defect frequencies | High | Schedule bearing inspection or replacement before failure |
| Cavitation | Crackling / gravel-like noise, fluctuating discharge pressure | High | Check NPSH available vs required; inspect suction line |
| Mechanical looseness | Erratic vibration, multiple harmonics of running speed | Medium | Inspect and re-torque foundation bolts and baseplate |
| Resonance | Sharp vibration spike near a specific operating speed | Medium | Perform a bump test; stiffen structure or shift natural frequency |
| Bent shaft | Vibration at 1× and 2× running speed, axial + radial | High | Check shaft runout; replace or re-machine if beyond tolerance |
| Hydraulic instability | Vibration when operating far from Best Efficiency Point (BEP) | Low | Adjust operating point closer to BEP where possible |
Imbalance
Uneven mass distribution on the rotating element
Misalignment
Pump and motor shafts not sharing a common centreline
Bearing Wear
Surface fatigue on races, balls or rollers
Cavitation
Vapour bubble collapse inside the impeller
Understanding Pump Frequencies
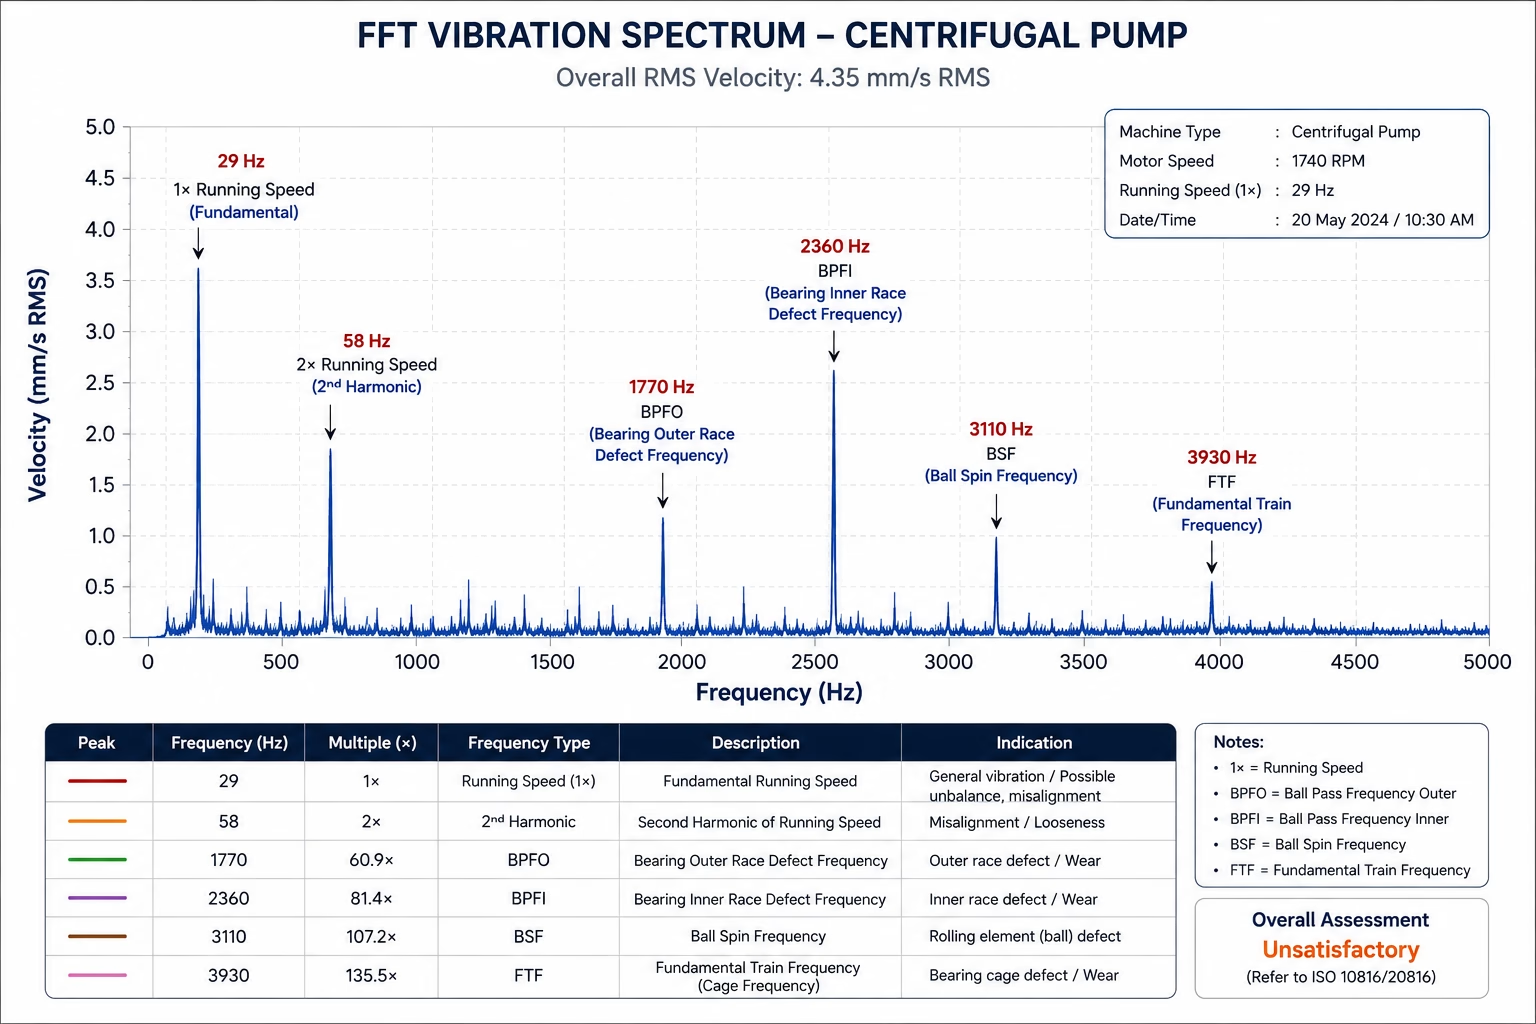
Every vibration reading is really a mix of frequencies layered on top of each other. Isolating them through a Fast Fourier Transform (FFT) turns a single overall number into a diagnostic fingerprint.
Running Speed (1×)
The fundamental rotational frequency of the shaft, expressed in Hz or CPM. Most imbalance faults appear here.
Vane Pass Frequency
Running speed multiplied by the number of impeller vanes — elevated amplitude here often points to hydraulic disturbance or impeller-to-volute clearance issues.
Bearing Defect Frequencies
Calculated from bearing geometry (ball pass frequency outer/inner race, ball spin frequency, cage frequency). These are typically non-integer multiples of running speed and are the earliest indicator of bearing deterioration.
Types of Pump Vibration
- Radial vibration — perpendicular to the shaft; commonly linked to imbalance, misalignment and bearing wear.
- Axial vibration — along the shaft centreline; often a sign of misalignment, thrust bearing wear, or hydraulic thrust imbalance.
- Torsional vibration — oscillation in the rotational direction; harder to detect with standard sensors, usually linked to coupling or drive-train issues.
Always measure in all three planes (horizontal, vertical and axial) at both the pump and motor bearings. A fault that is dominant in one plane can be completely invisible in another.
Vibration Monitoring Techniques
The right technique depends on the pump's criticality, accessibility and the failure modes you are trying to catch.
| Technique | Measurement Unit | Best Suited For |
|---|---|---|
| Overall vibration (RMS) | mm/s | General condition screening, trending |
| FFT spectrum analysis | mm/s vs Hz / CPM | Root-cause fault diagnosis |
| Envelope / demodulation analysis | gE | Early-stage bearing defects |
| Displacement measurement | microns (µm) | Low-speed, high-mass machinery |
| Velocity measurement | mm/s | Mid-frequency range, most common industrial pumps |
| Acceleration measurement | g / m/s² | High-frequency events, impacting and bearing faults |
ISO 10816 / ISO 20816 Overview
ISO 10816 (now superseded in most parts by ISO 20816) provides the internationally recognised framework for evaluating machine vibration severity through zoned RMS velocity limits. Zone boundaries vary by machine group, power rating and mounting type (rigid vs flexible foundation).
| Zone | Condition | Indicative RMS Velocity (Class II, rigid mount) |
|---|---|---|
| Zone A | Newly commissioned machine — excellent | Up to ~1.4 mm/s |
| Zone B | Acceptable for unrestricted long-term operation | ~1.4 – 2.8 mm/s |
| Zone C | Unsatisfactory for long-term operation; plan corrective action | ~2.8 – 7.1 mm/s |
| Zone D | Vibration of sufficient severity to cause damage | Above ~7.1 mm/s |
Figures above are indicative reference points for general guidance only. Always confirm the exact zone boundaries against the current ISO 10816 / ISO 20816 part applicable to your machine class and mounting.
Never rely on a single ISO table across all pump types. Vertical pumps, sub-baseplate mounted units and flexibly mounted machines are covered under different parts of the standard with different limits.
Step-by-Step Vibration Analysis Process
Baseline Measurement
Record vibration on a healthy, newly commissioned pump
Routine Data Collection
Measure at defined intervals across all bearing points and planes
Trend Comparison
Compare current readings against baseline and ISO zones
Spectrum Analysis
Run FFT to identify the dominant fault frequency
Root-Cause Diagnosis
Match the frequency signature to a likely mechanical cause
Corrective Action
Plan the repair during the next available maintenance window
Predictive Maintenance
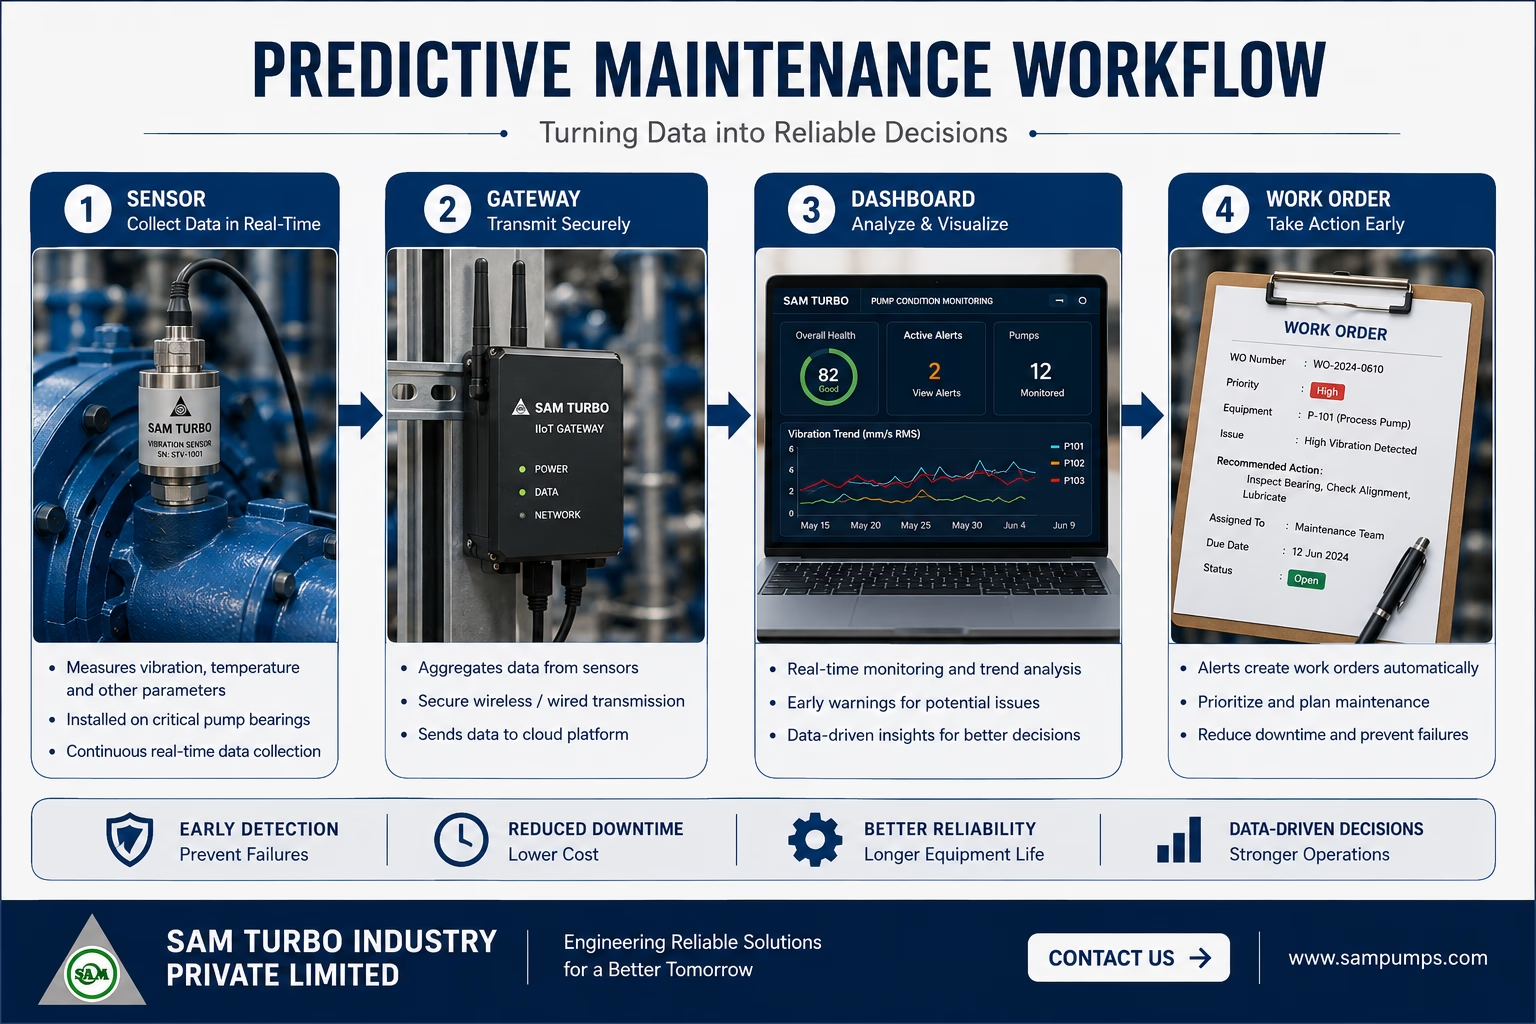
Predictive maintenance (PdM) shifts vibration monitoring from a periodic check into a continuous reliability programme. Instead of fixed maintenance intervals, work is scheduled based on actual equipment condition.
- Continuous online monitoring for critical, hard-to-access, or high-consequence-of-failure pumps
- Portable route-based monitoring for balance-of-plant pumps
- Automated alerts when readings cross pre-set alarm and trip thresholds
- Integration with CMMS / EAM systems for work-order generation
Best Practices
- ✓ Establish a vibration baseline immediately after commissioning or overhaul
- ✓ Measure in all three planes at every accessible bearing point
- ✓ Keep sensor mounting location and orientation consistent between readings
- ✓ Trend data over time rather than relying on a single reading
- ✓ Cross-check vibration data with temperature, flow and pressure trends
- ✓ Operate pumps as close to the Best Efficiency Point (BEP) as possible
- ✓ Re-baseline after any repair, rebuild or component replacement
Warning Signs
Between scheduled vibration checks, these signs often indicate a developing problem worth an immediate inspection:
- Unusual noise — grinding, gravel-like or crackling sounds
- Visible shaft, coupling or baseplate movement
- Rising bearing housing temperature
- Mechanical seal weeping or leakage
- Fluctuating discharge pressure or flow
- Loose or vibrating foundation bolts
A sudden, sharp increase in vibration — rather than a gradual rise — can indicate a fast-developing fault such as a fractured impeller vane or seized bearing. Treat sudden spikes as urgent regardless of the absolute reading.
Frequently Asked Questions
Conclusion
Pump vibration analysis is one of the highest-leverage tools available to a maintenance team: low cost to implement, and capable of preventing the most expensive failure modes a pump can experience. The engineers who get the most value from it are the ones who trend consistently, measure in all planes, and pair vibration data with ISO 10816 / ISO 20816 guidance rather than treating any single reading in isolation.
At SAM Pumps, our engineering team supports customers not just with pump selection, but with the reliability practices — including vibration monitoring guidance — that keep industrial pumping systems running at their best across power, pulp & paper, chemical, mining, fertilizer, sugar and water treatment applications.


